Long Nguyen1, Cuong Nguyen1, and Shoba Ranganathan2
Abstract
Galactocerebrosidase (GALC) is an enzyme that catalyzes the functional group of a toxic metabolite from myelin sheath production (myelination) named psychosine. GALC is activated by two nonenzymatic activators – saposin A and saposin C. Mutations in the gene coding for human GALC could result in the significant decrease of the enzyme activity, causing Krabbe disease, a rare autosomal recessive disorder in human (OMIM #245200). In this work, homology-modeling approach was performed to build a 3D model of human GALC from crystal structure of mouse GALC (PDB ID: 3ZR6). The generated model was structurally and energetically optimized, in the range of reasonable quality 3D structure, better in scores than the template structure. The central TIM barrel is slightly different between the model and the crystal structure while the β-sandwich domain is nearly identical. The calculation of electrostatic potential of human GALC surface revealed the facts that even mouse and human share high similarity in structure of GALC, the solvent accessible surfaces of the two proteins are noticeably different. The interactions between model of human GALC and its main activator, saposin A (in a dimer form – PDB ID: 4DDJ) were analyzed by applying molecular modeling, electrostatic energy analysis, computational docking simulations and interface side-chain refinement. The docking results show that SapA binds to the expected site, in the β-sandwich domain of the enzyme. The complex provides addition insights into the interaction between GALC and saposins as well as explanations for the complexity of clinical manifestations of Krabbe disease.
Introduction
Krabbe disease, also called globoid cell leukodystrophy (LGD) is known to be a serious inherited neurological disorder because about 90% of patient are early infantile – onset form with the clinical courses presenting rapidly with spastic paraparesis (partial paralysis), irritability, abnormal physical and mental development (1, 2). Most of affected infants could not pass age two (3, 4). The main cause of Krabbe disease is the genetic defects of β-Galactosylceramidase/Galactocerebrosidase (GALC) - a lysosomal enzyme responsible for catalyzing the functional group of galactolipid metabolites in nervous system (1, 5-9).
The galactolipid degradation requires the combined action of GALC and its small non-enzymatic activators known as saposins A and saposin C (SapA, SapC) (6, 10). Those activators are believed to facilitate GALC by modifying the physical states of sphingolipids and therefore GALC can access to the substrates (7, 11). Without them, GALC, a water-soluble enzyme, could not accommodate the membrane embedded lipid substrates (12, 13). At neutral pH, they exist in a closed monomeric saposin-fold conformation consisting of four cysteine-rich amphipathic α-helices, however, under the lysosome-like condition which is acidic and lipid-rich, more open and complex conformations were observed(14).
SapA is known to be the main activator for GALC and proposed interactions of GALC and SapA in homo-dimer form have been discussed in previous studies (1, 6, 7, 10, 15, 16). It is suggested that in Krabbe disease, some mutations in the gene coding for GALC have changed the binding face of GALC, interfering or preventing SapA from activating the enzyme, leading to the serious defects of the enzyme activity (4, 8, 16, 17). The deficiency of GACL activity leads to accumulation of the neurotoxic metabolites, causing the malfunction of the nervous system, exclusively the central and peripheral nervous systems (1, 9, 13, 18).
It remains unclear how the changes in GALC gene affect the enzyme activity as well as some aspects of the association mechanism between GALC and saposins. The highly diverse mutational profile of patients makes Krabbe disease remains unpredictable and not fully understood by solely looking at genotypic information at the GALC locus (19, 20). For example, even having the similar or identical phenotypes, the clinical courses of patients could be significantly different (8). We believed that analyzing the human GACL structure and the interaction of GALC and SapA could give insights into the Krabbe disease.
Molecular docking is a computer-based technique widely used for predicting the interaction sites of two or more biomolecules in a functional and stable complex (21-23). Molecular docking are now complementary with empirical laboratory experiments, and becoming more and more important in biological studies, especially in drug discovery and design (23-25). Therefore, the present study was designed to computationally examine the interactions between GALC with its main activators – SapA by using molecular docking approaches. However, only crystal structural of human SapA solved at high quality - 1.9 Å (11) available in PDB, there is no available 3D structure of human GALC to be used for the molecular docking. Therefore, the first step must be homology modeling in which a high accuracy model of human GALC is built based on a similar protein structure.
Homology modeling, also known as comparative modeling, is a computational approach used to model 3D structure of proteins whose structures are still uncharacterized. The principle governing this approach is that evolutionary related proteins share similar three-dimensional structures (26, 27). The process of structure prediction includes multiple steps including fold assignment, target-template alignment, model building and model evaluation (28, 29). In order to have high throughput modeling of the atomic model of protein of interest, i.e. a high accuracy molecular model of the 3D structure, experimentally determined known structures should have more than 50% sequence similarity with the protein of interest (27, 30, 31). The model could be built from one template with very high similarity with target sequence or from multiple templates, which share only some similar regions with the target sequence (32). However, an understanding of protein-protein interaction still plays central role in a successful docking experiment (33, 34).
Materials and Methods
Data collection
Complete sequences of human GALC protein (685 amino acid) were retrieved from UniProt database (35) (Accession No: P54803, Isoform 1). At the moment, mouse GALC is the only solved crystallography structure of GALC at reasonable quality (2.4-Å). The sequence similarity between two organisms is 82.8%, qualified for high throughput homology modeling process. Thus, the X-ray structure (PDB ID: 3ZR6) (16) was then selected as the template for building 3D model for human GALC.
ClustalW version 2.0 (36) with BLOSUM mode in default was employed to align the sequence of template structure and target sequence (Appendix Figure 1). The numbering of amino acid in GALC peptide sequence was based on the 42-peptide signal peptide sequence. The signal peptide present in human GALC gene with the length of 42 amino acids was removed as it was absent in the template protein structure. The missing residues in template sequence were replaced with “-” symbol.
Homology modeling
The procedure of homology modeling was followed by Huynh et al. (37). The overall homology modeling procedure consists of six steps: (1) Homology models were built based on the X-ray crystal structure of mouse GALC (PDB ID: 3ZR6) by employing Modeller version 9.9 (38). (2) Sequence extracted from PDB file (ID: 3ZR6) (template sequence) and human GALC sequence (target sequence) were realigned by Modeller using refined alignment algorithms to produce optimal alignment. (3)Five draft models of the human GALC with optimal satisfaction of spatial constraints and dihedral angle restraints were built automatically using the automodel class. (4) Once the models were constructed, refinement process including loop refinement, water exclusion, sulfide bridge construction and ligand inclusion were performed (Appendix Figure 2). (5) Models were assessed by two functions namely Discrete Optimized Protein Energy (DOPE) (39) and GA341 (28, 40) and the model with lowest DOPE score and highest GA341 score is chosen to be the model of human GALC (6) Protein structure quality of the selected model was validated by Protein Structure Validation Suite (41) which consists of tools namely PROCHECK (42), PyMol (43), Verified3D (44) and PDB Validation (45). Report about stereo chemical properties, φ–ψ angles, bond lengths, root mean square deviations (RMSD) and energy provided by Modeller was also considered for the validation of the final model.
Human GALC model was also analyzed by 3D superimposition on its template, and Ramachandran plot. The visualization of models was done by using Internal Coordinate Mechanics (Molsoft ICM –Pro version 3.7) software package (33).
Protein surface analysis
Electrostatic surface analysis of GALC and SapA were performed using PDB2PQR online server (46), which employs PROPKA (47) to assign pKa values for proteins. APBS plugin (48) integrated with PyMol (43), a program used for molecular graphics preparation and visualization, was used to calculate the partial charges in the surface of GALC and SapA. The surfaces were then colored by electrostatic potential at the solvent accessible surface with potential scale set from -3 kT/e (red, negative) to +3kT/e (blue, negative) with pH value set at 4.8.
Protein-Protein docking
The structure of SapA in form of homo-dimer is not available in PDB but the PDB files of each monomer were provided by Popovic’s group by whom the symmetric structure of SapA was solved at high quality - 1.9 Å (11). Those structures were selected for the docking process with GALC models. Internal Coordinate Mechanics (Molsoft ICM –Pro version 3.7) software package (33) was used for the identification of GALC-SapA binding site, following the protein-protein docking procedure at http://www.molsoft.com/icmpro/protprot.html. The docking batch was run on local machine (Intel Pentium 4, 3.00GHz, Windows XP Professional).
ICM-Pro converted protein structures from PDB format to workable objects. Ligand (SapA) and GALC (receptor) were then modified and optimized according to the available parameters. Association site was chosen based on the electrostatic surface analysis of the two structures. The Optimal Docking Area (ODA) function (34) was employed to calculate the desolvation energy of various surface regions of the two proteins. Specific epitopes were selected before being energetically refined. A receptor maps was made for the regions of interest with default maximum Van der Waals value.
ICM-Pro used different approaches (molecular dynamics (49), Monte Carlo methods (50) and genetic algorithms) for searching and determining all possible conformations before calculating energy for each resulting interaction. During this process, Van der Waals or hydrogen bonding interaction was excluded; side-chain entropy change was estimated. Hydrophobic energy was also determined using surface term with constant surface tension of 20cal/Å. Once the docking finished, result table of all possible optimal conformations sorted by energy and docking data was generated. The protein complex with lowest energy and RMSD value was then further refined by using optimization-docking algorithm. Docking process was repeated 3 times before the protein interaction in the optimized complex was analyzed. The complexes were converted to PDB file, added chain IDs and renumbered by using online tools named Rename chain and Renumber Residue Numbers respectively (available at http://www.canoz.com/). Finally, the edited files were then submitted to PDBsum, a web-based database (51) to generate schematic diagrams representing the detail information of the interaction within the complex.
Results
High quality 3D structural models of human GALC
After undergoing various steps in, energy levels and scores calculated by different assessment methods DOPE and molpdfqseq1.B9999000282272.922). Modeller automatically provided additional function for generated models, which was molpdf. The joint probability density function is used specifically for ranking a given set of restraints. The lower the score, the better the model is. As the result, model qseq1.B99990002 was successfully qualified locally and universally. It was then chosen to be the model of human GALC and be taken for further quality analysis.
Table 1. Five similar models of human GALC based on the 3zr6 template structure and the alignment in file in ALI format between human GALC and mouse GALC.
|
Human GALC models
|
molpdf
|
DOPE score
|
|
qseq1.B99990001
|
4796.56641
|
-80883.87500
|
|
qseq1.B99990002
|
3996.59521
|
-82272.92188
|
|
qseq1.B99990003
|
4132.90771
|
-81788.81250
|
|
qseq1.B99990004
|
4212.66309
|
-81572.99219
|
|
qseq1.B99990005
|
4419.36475
|
-81157.08594
|
Table 2 shows the results of the quality assessments of the selected model. In comparison to the template structure, the model has high similarity to the template structure with RMSD value of 0.172 Å. PROCHECK predicted that human GALC model had 98.9% of residues in conformationally allowed regions in total of 643 residues. Among that, 90.6% of residues in most favored regions and 80.3% of residues in additional allowed regions. The model was built with higher percentage of residues in favorable regions (90.6%) than these in the crystal template structure (85.1%). It also satisfied the requirement for a high quality X-ray crystal structure that is at least 85% of residues ought to be in allowed regions. Ideal geometry for bond angles and bond length deviations of the model was 2.2° and 0.018 Å, respectively. According to Diago et al., the deviation values of human GALC model indicate that the solved structure has good resolution (45).
Table 2. Structure assessment carried on different testing programs.
|
Model
|
Results of selected models
|
||||||
|
RMSD
(Calculated
by PyMoL)
(Å)
|
PROCHECK
(Ramachandran plot statistics)
|
Verified3D
(Z-Score)
|
ENERGY
(Reported by Modeller)
(Kcal/mol)
|
PDB Validation
(Deviations from Ideal Geometry)
|
|||
|
Residues in favored
regions
(%)
|
Residues in allowed
regions
(%)
|
Bond
Angles
(Degree)
|
Bond
Lengths
(Å)
|
||||
|
Mouse
|
-
|
85.1
|
13.8
|
0.48
|
-
|
1.3
|
0.010
|
|
Human
|
0.172
|
90.6
|
8.3
|
0.32
|
- 82418.2
|
2.2
|
0.018
|
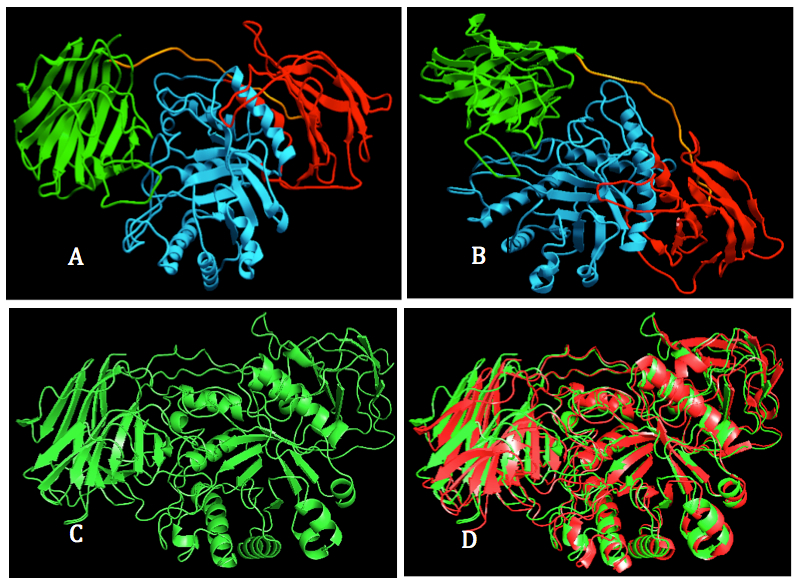
Figure 1. Visualization of human GALC 3D model. A, B: Two orthogonal views of structural model of human GALC. The enzyme was colored their domain: lectin (green), tim barrel (cyan) and β sandwich). C: 3D model of human GALC shown in green ribon form. D. Superimposition of human GALC model (Green) and mouse GALC crystal structure (Red).
There is no evidence of additional disulfide bonds beside the sulfide bridge between C287 and C394 (Figure 2A). The water in the X-ray crystal structure of mouse GALC were excluded during the construction of human GALC model because they are on the surface of the protein and might not involve in the functional activity of GALC (37, 53). However, all the ligands binding to crystal structure of mouse GALC were added to the model of human GALC because they depict the interactions of the enzyme with other substrates in its native environment (Figure 2B). Ligand inclusion step is very helpful for analyze the enzyme activity and further analysis of interaction of GALC-SapA in molecular docking experiment.
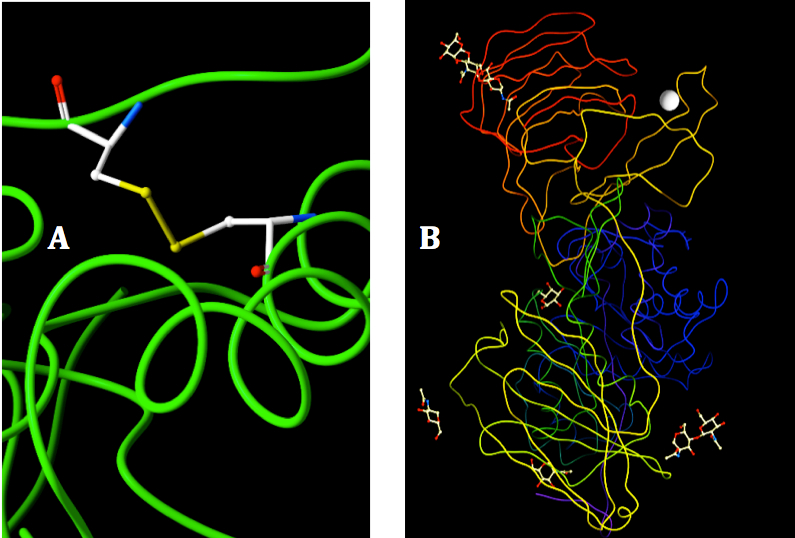
Figure 2. Visualization of disulfide bond and binding ligands in the 3D structure of human GALC. A: The disulfide bond of C287 and C394 was shown in color stick, backbone structure shown in green color. B: Ligands bound to the human GALC. Ligands were shown in color sticks, Calcium were represented by the gray shrere and the subunits of GALC were shown with different colors.
Structure analysis of human GALC models and SapA
Electrostatic interactions play an important part in determining properties of biomolecules (54). We used PyMol and ABPS plugin to determine and visualize the electrostatic potential of the surface of human GALC and SapA. Experimental and theoretical studies with mouse GALC have suggested the regions in GALC involving in the interaction of the enzyme with SapA were near the substrate-binding pocket and have highly positive charge (16). Therefore, the computation of electrostatic surface generated by 3D model of human GALC and SapA is very important in actually localizing the possible regions that further used in the protein-protein docking simulations. This method generates the skin representation of the molecular surface colored according to the electrostatic potential at the solvent accessible surface from red to blue, showing the charge from negative to positive, respectively. The program used for the calculation was APBS, which evaluates the electrostatic properties of protein at certain pH (determined by PROPKA program) before assigning protonation for side chain (48).
The electrostatic analysis of GALC surface depicted in Figure 3A, 3C showed blue region which were lay all over the binding face of protein. The overall surface of human GALC was highly positively charged, not just two highly negatively charged patches near the substrate-binding pocket as suggested by Deane et al (16). There were also two patches that were neutral or positively charged located in lectin domain and β-sandwich domain because they are colored with light blue and white.
On the other side of human GALC protein (Figure 3B), the surface possessed both negative and positive charge. Highly negatively charged patches were located mostly in β-sandwich domain and lectin domain. The patch with positive charge was laid on TIM barrel domain. According to previous studies, the lectin domain of GALC is suggested to be the recognition site for carbon hydrate binding, not to be involved in the binding of saposin (16). Therefore, the highly positively charge located in β-sandwich domain is expected to be the interaction site of GALC and SapA as activators. The regions could be selected for binding regions of GALC and SapA in the protein-protein docking experiment.
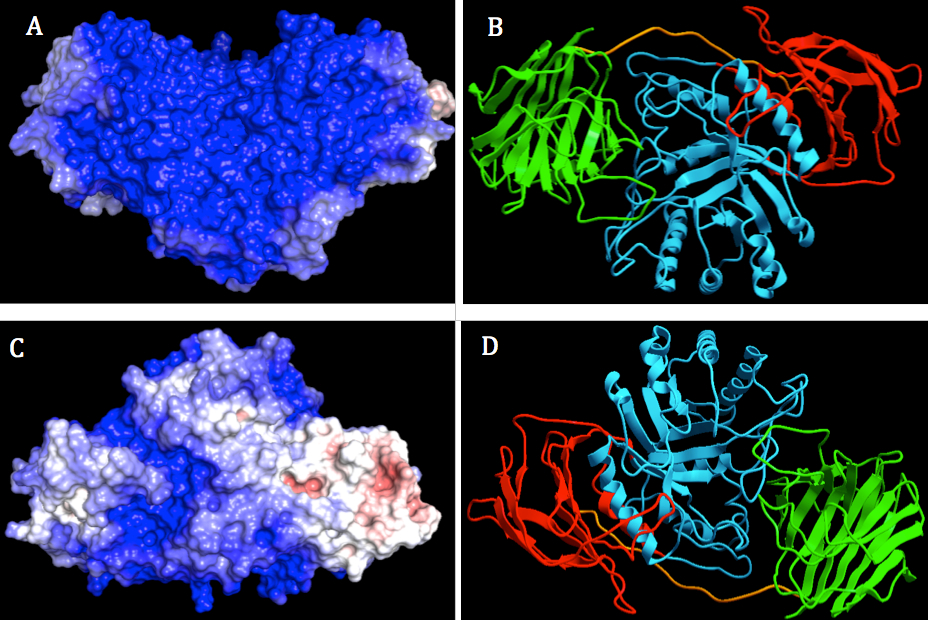
Figure 3. Two orthogonal views of electrostatic surface and ribbon display of human GALC using ICM-Pro. The surface was colored by electrostatic potential at the solvent accessible surface with scale from - 3.0 kT/e – 3.0 kT/e. Color ranged from blue (represented for positively charged) to red (represented for negatively charged). The pH value set for side chain protonation was 4.8. . Left: Molecular surface display with different orientation of GALC (A, B). Right: Ribbon display of GALC, lectin, β-sandwich and TIM barrel domains were colored with green, red and cyan, respectively (C, D).
The comparison of surface electrostatic potential between human GALC and mouse GALC was also carried out. However, it could only assign protonation for side chains at neutral pH 7.0. GALC is the enzyme actively functional in acidic lysosome; therefore, the use of PyMol and its plugins were employed to estimate the correct electrostatic potential of GALC surface. The calculation of electrostatic potential of human GALC surface revealed the facts that even mouse and human share high similarity in structure of GALC, the solvent accessible surfaces of the two proteins are noticeably different.
The binding face of GALC in mouse was varied in charge, ranging from highly negatively to highly positively charge while in human, it was mainly highly positive charged. On the other side of the enzyme, positively charged and negatively charged patches were similar in pattern in both human and mouse GALC. The different in electrostatic potential of the surface of GALC between the two organisms could be explained by the different in amino acid arrangement in the surface of protein structure.
The highly conserved region between human and mouse GALC was laid mainly in TIM barrel (residues from 25-126 in mouse GALC and from 41-142, respectively, in human GALC) and apart of β-sandwich domain (residues from 326-381 in mouse GALC and from 342-397 in human GALC). That region was considered as the core of binding pocket of GALC and buried inside the structure of GALC structure.
In contrast, the other regions from residues 242-268, 401- 447 and 630-644 in mouse GALC were not conserved with those in human (residues 258- 284, 417-463 and 646-660 respectively). In mouse GALC sequences, some aligned residues in those regions could change significantly in properties from neutral and negatively charged to positively charged residues in human GALC (S466->K, T576->R, T416->K, Y242->H, A350->K, W245->K, Q374->K). The changed residues mostly in the loops of β-sandwich domain and exposed to the solvent accessible surface. Therefore, the electrostatic potential of protein was significantly different between the two organisms, especially in β-sandwich domain.
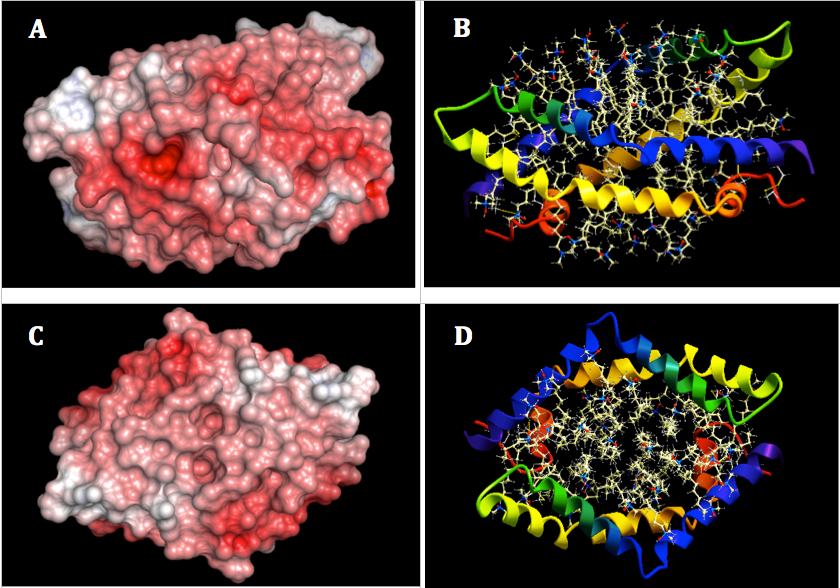
Figure 4. Two orthogonal views of electrostatic surface of SapA homo-dimer using ICM-Pro. The surface was asssigned color by electrostatic potential at solvent accessible surface ranged from blue (negative, -3kT/e) to red (positive, 3kT/e). pH value was set at 4.8 for the calculation of the electrostatic potential. Left: Molecular surface display with different orientation of SapA (A, B). Right: Ribbon display (C, D).
The calculation of electrostatic potential of SapA homo-dimer also was also included the bound zwitterionic detergent lauryldimethylamine-N-oxide (LDAO) for higher accuracy of electrostatic potential of SapA in the presence of lipids (Figure 4). In the open form, inner hydrophobic regions of SapA are exposed thus covered by LDAO. Two open V-shaped chains of SapA form a bilayer-like disc with a hydrophobic core interacting with LDAO. Hydrophobic core is the only contributor in holding the disc as there are expected no saposin-saposin interactions (11). The lipoprotein disc with hydrophobic core possesses highly negative charge due to the presence of LDAO. Only parts of the complex have negatively charge. The lipids altered the electrostatic potential of the complex surface.
Protein-protein docking
The surface of SapA posseses a highly negatively charged thus it is expected to bind to positively charged regions on GALC surface. Based on the electrostactic surface analysis of GALC, the regions on GALC surface are showed to be positively charged (Figure 5) which are potential for saposin binding. Especially, a positively charged pocket, located on the intersection area between Tim barrel domain and β sandwich domain and near the substrate binding site of GALC, was expected to be the potential association site of GALC and SapA (16).
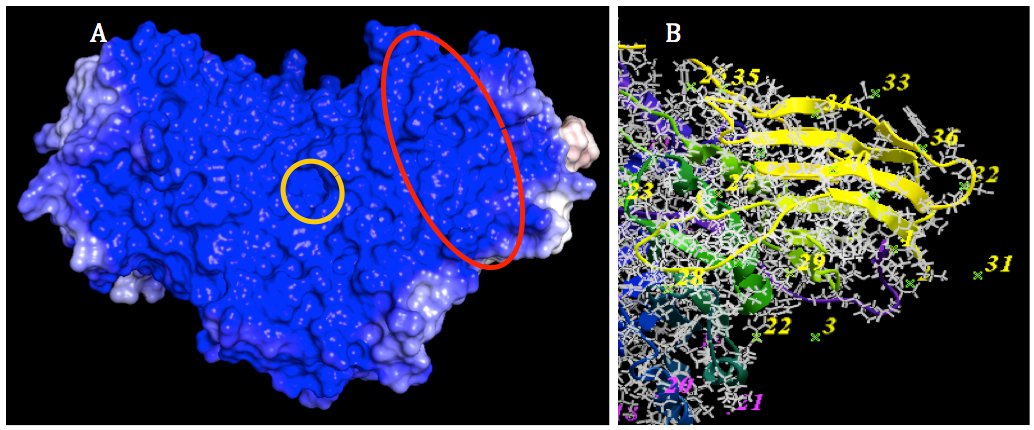
Figure 5. Prediction of binding site for SapA on GALC surface. A: The SapA binding site of GALC (marked by a red oval) was predicted to locate on the interection area between TIM barrel domain and β-sandwich domain which is near the subtrate binding site of GALC (marked by a yellow circle). B: Epitope selection for ligand binding. The number indicated epitopes that are possible for ligand to bind. After the selection, 19 out of 53 epitopes selected. The color of number indicated these epitopes were changed to yellow. The unselected epitopes kept the original color (purple).
The docking process was done with two replications, showing that SapA binds to the expected site in GALC (Figure 6). The binding site on GALC surface has high agreement between the two replicates. Approximately 20 residues of GALC surface involved in the interaction with SapA, among those 14 residues were reproductively appeared in two replicates (Figure 7). Only one monomer of SapA contributes in the interaction; however, the binding site for GALC of SapA was slightly different in two replicates. A: in the first docking replicate, SapA interacted with GALC by mainly helices 1, loop of helices 1 and 2 and the c terminal of helices 3. B: the second docking experiment, SapA interacted with GALC by mainly helices 1 and helices 4 and the loop of helices 3 and 4.
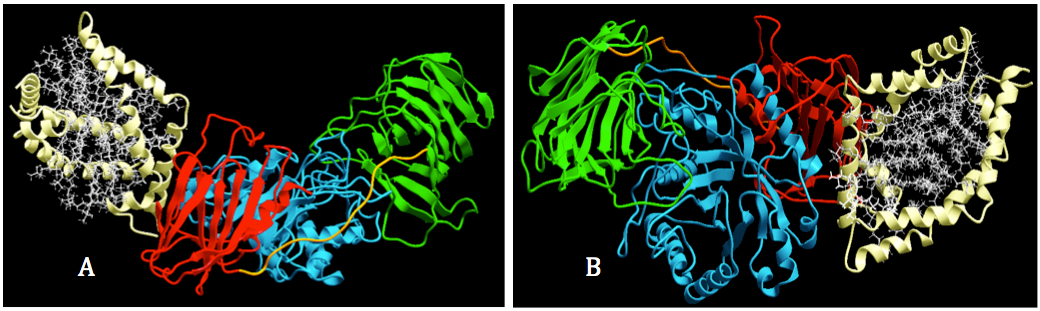
Figure 6. Visualization of interaction between GALC and SapA. Docking process was performed by using protein-protein docking in ICM-pro. A. GALC was colored according to their domains: lectin (green), TIM barrel (cyan) and β-sandwich); and SapA was corlored in white. B. The binding site for SapA of GALC was located on the intersection area between TIM barrel domain (cyan) and β sanwich domain (red).
The complex of the first replicate has lower free energy than the second one (-57.9 and -65.5, respectively). Lower energy presents a more stable status of the complex thus the first complex posses a better interaction posibility of GALC and SapA. RMSD values represent the changing in comformation protein before and after forming the complex. RMSD value of the first replicationa (18.1) was smaller than the second one (24.0), showing that after the fisrt replication of docking, the comformation of two proteins was changed less than thoes in the second one. However, the complex built in the second replication was more accurate than the first one in term of lower energy and RMSD.
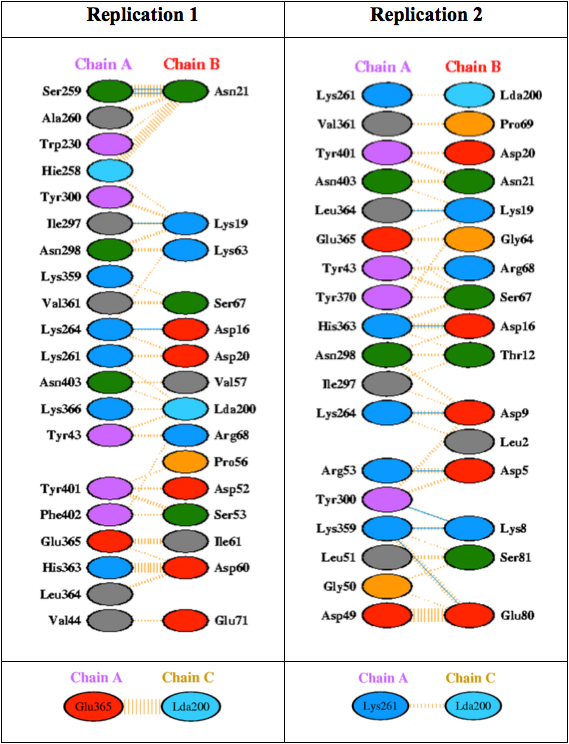
Figure 7. Residue interactions across interface of GALC and SapA. GALC (chain A) interacted with only one chain (chain B) of the homo-dimer SapA. Interactions between two chains were represented by colored lines: nonbond contacts (orange), hydrogen bonds (cyan). Residues of each chain involving in the interaction were presented by ovals colored according to their properties of amino acid sidechain:Positive (H,K,R); negative (D,E); neutral (S,T,N,Q); aliphatic (A,V,L,I,M); aromatic (F,Y,W); Pro & Gly (P,G); Cysteine (C). RMSD: Root mean square deviation.
The first replication shows that between two chains within the saposin dimmer, one chain (chain B) interacts mainly with GALC (chain A). In total, there were 15 residues of SapA which are mainly located in helices 1, loop of helices 1 and 2 and the c terminal of helices 3 formed 109 interactions with 20 residues on the surface of GALC. Among those, majority is non-bond interactions (104) and four interactions are hydrogen bonds formed between Ser 259 and Asn 21; Ile297 and Lys 19; and Lys 264 and Asp 16. There are no salt bridges and disulfide bonds recorded. Interface of GALC is smaller than SapA (966 compared to 1022Å). Similar to the first replication, the second shows only one chain of the homo-dimer SapA interacted with GALC at expected site. However, the interacted site in SapA is slightly different to the first replication. Most of the helices 1 and helices 4 and the loop of helices 3 and 4 contributed in the interaction between SapA and GALC. This interaction was formed by mainly 134 non-bond contacts and seven hydrogen bonds. The detailed visualization of interaction between GAL and SapA was shown in Figure 8.
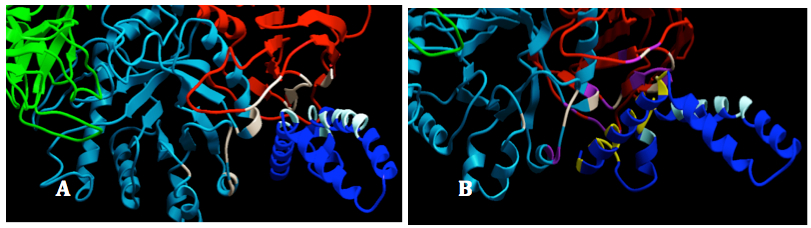
Figure 8. Interactions between GALC and SapA. GALC was colored by domain: lectin (green), TIM barrel (cyan) and β-sandwich); SapA chain B was colored in blue and SapA chain A was hidden: Interacting sites between GALC and SapA (chain B) in replicate 1. The residues listed in the interface statistics were colored white in GALC and bright cyan in SapA (Chain B). B: Interacting sites between GALC and SapA (chain B) in replicate 2. The residues listed in the interface statistics of replicate 2 were colored purple in GALC and yellow in SapA (Chain B). The residues interacted in the replicated 1 were still colored as in 14A for binding site comparison.
Discussions
3D model of human GALC
High quality structure of human GALC was built by using the crystal structure of mouse GALC as template. However, the validation results returned from Protein Structure Validation Suit have shown that the correctness of crystal structure of mouse GALC was not as high as we expected. The Z-score of 0.48 generated by Verified3D was not in allowed region (-1.0 – 0.0) suggested that the protein might not be adequately refined (44). It might due to the accuracy of the template structure. Assessment of mouse GALC structure by statistics derived from Ramachandran plot using PROCHECK and Z-score using Verified3D indicated that the crystal structure was only solved at moderate quality.
The optimization of Modeller showed significant improvement in the quality of human GALC. The model quality could be better if Modeller did not have to build model structure of human GALC for residues 432-434 by loop modeling due to the missing information of structure in that region of template structure (residue 416-418 with alternating numbering) (16). The correctness of 3D model of human GALC could be maximized with further refinement rounds.
In this work, the human GALC structure was built based on peptide sequence taken from UniProt with accession Number of P54803, isoform 1 because it had the highest similarity to the template sequence of mouse GALC in comparison to other isoforms. There are also four more isoforms with different chain length and different amino acid composition listed in the database. In addition, natural variants of those peptide sequences and the sequence conflicts as well as different numbering methods among studies have made a lot of confusion for us to select the right sequence for homology modeling and molecular docking. The computed model of human GALC was only considered as the initial steps for characterizing and understanding the structure and binding mechanism of human GALC with its activators.
Interactions between GALC and SapA
Choosing a suitable conformation from various conformations generated by docking program was done with care. The most important criteria for selecting conformation were the binding energy and the RMSD. The energy value shows how stable the complex is while the RMSD shows how proteins in the complex differ from the original proteins selected for docking experiment. ICM-Pro has generated complexes of GALC-SapA with low energy score and small RMSD value, indicating that the complexes satisfied almost all criteria for high quality bimolecular complexes. The energy score was given based on the evaluation of binding energy. All of the complexes had energy scores given by ICM-Pro much lower than -32 (GALC-SapA complex: -57 and -65 for two replicates), showing that they were at stable conformation and near their native structures.
The docking of GALC with SapA-lipid complex showed that only one monomer of the SapA dimer actually interacted with GALC at binding site. However, the result needs to be examined in further studies for validation.
Mutations in the binding region of GALC and SapA related to Krabbe disease
Location analysis of the mutations occurred near the binding site suggests correlation between genotypic modifications and the pathological consequences. We focused on the previously reported mutations causing modifications of surface charge. The residues involved in the interaction of the enzyme and its activators belong to the β-sandwich, from residue 259 to 403 and some residues at the beginning of GALC sequence (43-53). The residues that reproductively appear in two replicates of docking process are mainly in the range of 300-403 with a little variation. For example, the disease causing mutation E231K is a missense mutation located in the TIM barrel domain, relatively close to one of residue (W230, replicate 1 of GALC-SapA; 229 and E231) involved in the binding of the activators (19) . This mutation is occurred in the surface of the enzyme, changing an acidic side chain (Glutamic acid) to a large and basic one (Lysine), leading to the change of local surface charge (16). The change in turn slightly alters the interaction site of GALC and SapA, which located closely, making them could not efficiently bind to each other. Therefore, GALC enzymatic activity in glycolipid degradation is decreased, leading to mild condition of Krabbe disease.
Unlike E231K mutation that occurs in TIM barrel domain, the mutation K359AfsX3 occurs in β-sandwich domain, one of the interacting residues between GALC and SapA (reproductively shown in both replicate 1 and 2). It was reported to cause serious clinical course, which is muscular hypertonia to Krabbe disease patient at very early stage (infantile onset – six month old) (3, 20). Study of Tappino and coworkers showed that the enzymatic activity of GALC was 20% as normal which means it was able to catalyze the hydrolysis of galactolipids, but not effectively (20). The change from Lysine, a positively charged side chain to Alanine, a hydrophobic side chain as well as frame shifting was significantly alter the binding face of GALC and SapA. Therefore, from the analysis of binding face between GALC and SapA, we could show some correlations between mutations and the phenotypic expression in Krabbe disease.
Mutations in lectin domain might not affect to the binding of Saposin to GALC, however, it could modify the formation of substrate binding cleft, preventing GALC from catalyzing glycolipids (16). Lectin domain was also suggested to be involved to GALC processing and trafficking like galectin family (55). Mutations occurred in this domain such as G533R, L645R may change the structure or electrostatic potential of GALC surface, leading to the misfolding of protein or the unrecognition by transporting channel such as M6P-independende mechanism (3, 19, 20). Therefore, even the binding site between GALC and SapA is fully functional; the enzyme could not work properly because it is not taken up. Similarly, mutations that locate in TIM barrel such as S273F and T278I could alter the substrate binding site, causing the degradation of galactose moiety could not be done even the galactocerebroside and psychosine were brought to GALC by Saposins(16, 56, 57). The effect of mutations to structure and characteristic of GALC could be carried out by homology modeling and docking approach in future studies.
The clinical manifestations caused by the mutation similar to those caused by mutations in GALC and were compatible with the diagnosis of Krabbe disease (2). The patient with normal GALC still got Krabbe disease and ended in death at eight–month old (15). Recently, mutation in SapA coding region of the prosaposin gene was reported by Spiegel et al. (15), suggested that Krabbe disease might not be caused solely by the mutations from GALC, but also from SapA. It also increases the complexity of identifying causative mutations of Krabbe disease and makes the proposing suitable therapeutic approaches more challenging for researchers.
Conclusions
In this work, by applying homology-modeling method, we have modeled 3D structure of human GALC from mouse GALC. Among the models generated by modeling program, we selected a 3D model that was the most energetically satisfied. Although there is high similarity between the protein structure of human GALC and mouse GALC, few differences were identified when the calculation of electrostatic potential of protein surface was carried out. Overall, SapA interacted with GALC at region located in the β-sandwich domain of the enzyme structure. The computational experimental results were similar and support to the previous studies.
In the followed up studies, the refinement steps will be carried out strictly to produce the model of human GALC with higher accuracy, readily for various molecular dynamics simulations. The docking procedure will allow us to analyze the recognition site(s) for each activator and the interactions of GALC with both activators. The comparison between SapA and SapC interactions with GALC surface will provide additional insights into the key amino acids in the activation of GALC by the two activators. It might reveal the combined effects of both activators to the galactolipid degradation of the enzyme.
Mutational study will also be carried out by applying homology modeling and molecular docking to construct mutated 3D model of human GALC based on the wild type GALC then dock it with saposins for analysis of impacts of mutations onto the changes of protein structure of GALC.


Add new comment