An Thuy Vo1, Giang Thanh Dien Nguyen1, and Hue Thi Nguyen2,*
Abstract
Breast cancer is the most frequent malignancy and the leading cause of cancer death among females. Numerous SNPs linked to the breast cancer have been identified in Genome Wide Association studies. Among those, SNPs in FGFR2 gene are found to be important markers for breast cancer susceptibility. In this study, High resolution melting analysis was designed for screening the A and G alleles of SNP rs1219648 on FGFR2 gene in a group of 109 breast cancer blood samples. In order to perform this study, DNA was extracted by the Salting-out method and the HRM method was optimized based on the concentration of PCR reagents such as DNA, Mg2+, and primers. Despite some disadvantages and limits during employing HRM method, this study showed that the HRM analysis is a reliable, simple tool and a cost-effective method for identifying the SNP rs1219648 on FGFR2 gene. Analysis of 109 breast cancer samples revealed that the frequency of A allele was 57% and the frequency of G allele was found to be 43%. The frequency of minor G allele supports to the further association study to identify the genetic markers for early diagnosis of breast cancer for the Vietnamese.
Introduction
Breast cancer (BC), one of the most common cancers worldwide for woman, ranked the second leading cause of cancer-related death and lethal cancer (1). It accounts for 25.2% of all cancers and 522,000 deaths annually in 140 of 184 countries worldwide in 2014 (2). Breast cancer is now diagnosed more frequently among women living in Asian countries, especially younger women. In Viet Nam, the breast cancer incidence has increased steadily over the last decade from a crude rate of 13.8 per 100,000 women in 2000 to 28.1 per 100,000 women in 2010, with an estimated 12,533 breast cancer cases in the country (3).
The biological mechanism of BC was driven by diverse aetiologies which involves both intrinsic factors (host genetic) and extrinsic factors (environmental factors). Being a complex polygenic disease, about 5% to 10% of breast cancer cases are thought to be hereditary, meaning that they result directly from gene defects inherited from a parent (1). In this research, the main focus is FGFR2 gene. FGFR2 gene is located on the long (q) arm of chromosome 10.This gene encodes multiple isoforms due to alternative splicing. FGFR2 gene encodes two alternatively spliced, transmembrane receptor tyrosine kinases which induce adaptor proteins activities to activate oncogenic MAPK pathway. This pathway increase cell proliferation, migration, and survival. Therefore, over expression of FGFR2 due to gene mutation may lead to out of control cell proliferation.
Particularly, in this study the SNP rs1219648 on FGFR2 gene will be a focal point. The SNP rs1219648 represents the one in the intron 2 of the FGFR2 gene with the strongest association with breast cancer (4, 5). Single-nucleotide polymorphisms (SNPs) identified within intron 2 of FGFR2 gene are associated with an increased risk of breast cancer (5, 6). The mechanism could be due to several putative transcription factor-binding sites in this intron which lie in close proximity to the reported SNPs. Therefore, it was speculated that the alteration of binding affinity of transcription factors causes an increase in FGFR2 gene expression (7).
With the purpose of detecting SNP, HRM Analysis which is a recently developed technique is applied. The aim of this study is to recommend a new simplest and more advantageous method, HRM, for genotyping single nucleotide polymorphism in general or SNP rs1219648 in particular; and also to estimate the frequency of SNP in Vietnamese breast cancer patients primarily.
Materials and methods
Samples preparation: In this study, the population screened consists of 100 female individuals with breast cancer. All subjects participating provided signed informed consents into this study. Blood sample collecting is approved by Ho Chi Minh City Oncology Hospital in a randomized manner from 2010 to 2014. After selecting samples, DNA was isolated by using salting out method. The DNA was kept in -200C for next experiments. All DNA samples have to extract with the same method. All DNA samples used in this study had A260/A280 values between 1.8 and 2.0 and concentrations were more than 50 ng/μL.
SNP selection and primer design: To identify the correct gene sequence containing the SNP, the NCBI web search engine (http://www.ncbi.nlm.nih.gov/) was recommended. Basing on the target gene containing SNP rs1219648, a pair of specific primers was designed to amplify a small amplicon surrounding the SNP by employing Primer3plus. Potential primer sets and full-length amplicons could then be tested for specificity using a BLAST search on the NCBI site (http://www.ncbi.nlm.nih.gov/blast) and UCSC-in-silico PCR (http://genome.ucsc.edu/cgi-bin/hgPcr). The primers were summarized in the Table 1.
Predictive melt curves were also generated from the optimized primer sets using uMelt software, a flexible web-based tool for predicting DNA melting curves based on adjusting MgCl2 (https://www.dna.utah.edu/umelt/) (Figure 1).
Table 1. Primers and their melting temperatures.
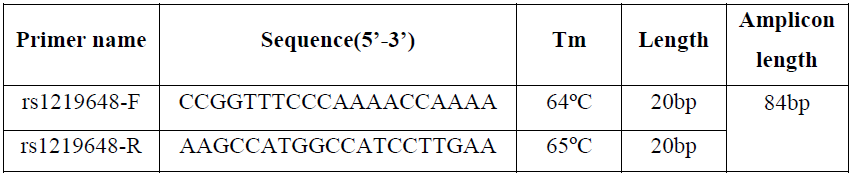
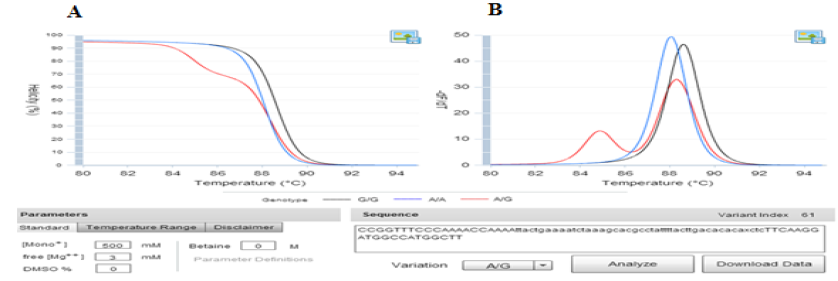
Fig. 1. The prediction melting curves of three different genotypes on uMelt HETS software. Picture A) showed the Normalized melting curves and B) provided the Normalized melting peaks of three different genotypes at 3mM of MgCl2 concentration.
Optimizing High Resolution Melting (HRM) method: Annealing temperature (Ta) is the range that primers enable to bind to the template. The rule of thumb is to use an annealing temperature that is 3-5˚C lower than the melting temperature (Tm) of the primers. In this study, optimization Ta was carried out by the thermal gradient from 58˚ to 68˚C with 20C increment. Applying the optimal Ta, optimization concentration of MgCl2, DNA, and primers was carried out. This facilitated researchers to obtain the best conditions for PCR product creation. The MgCl2 concentration was varied from 1.5mM to 3.5mM in 0.5mM increment. In this research, the primer concentration was carried out by the gradient from 0.1μM to 0.4μM. DNA template may be shared or may contain PCR inhibitors; therefore, the optimum DNA concentration with purity from 1.7 to 2.0 must be completed. The range for optimizing DNA concentration was from 10ng/reaction to 60ng/reaction. All results were analyzed by running gel electrophoresis.
Identification three control samples and sequencing confirmation: After finishing the optimization processes, the best conditions were utilized to identify three control samples which had three accurately different genotypes and should include in each assay performance. The confirmation of control genotypes was performed by sequencing analysis.
High resolution melting (HRM) optimization: The control samples were then used in High Resolution Melting (HRM) optimization. In this process, the adjustment of MgCl2 was carried out again. LightCycler® 480 High Resolution Melting Master Kit was employed to set up the amplification reactions for the genotyping. The reagent components were mixed together with the final volume of 20μL, including 0.4μL of each forward and reverse primer, 2.4 μL of 25mM 5
The components per reaction include MgCl2, 10μL of HRM master mix, 1μL of DNA (20ng/ μL), and 5.8μL dH2O. After identifying the ideal conditions, it is easy to obtain clear discrimination between sequence variants in Normalized melting peak, Normalized melting curve, and Difference plot of LightCycler 96 Real-time PCR System instrument. Firstly, PCR was run with 40 cycles, including 950C for 30 seconds, 630C for 30 seconds, and 720C for 30 seconds. Then, HRM was performed immediately melting process with temperature range from 650C - 950C. The HRM protocol was completed to genotype 109 DNA samples. There were 20 samples, three positive, and one negative controls performed alongside the experimental PCR. Results were then analyzed using fluorescence versus temperature graphs which were generated by Light Cycler® 96 Application Software Version 1.1.
Results
The optimum annealing temperature: From the Tm of selected primer, the range of Annealing temperature (Ta) from 580C to 680C was chosen to find out the good result for the PCR which amplified the target DNA containing the SNP position. The result indicated that with Ta from 580C to 640C, the DNA target can be amplified well with bright bands and no primer-dimer. That also strongly supported for success of specific primer design. However, Ta at higher temperature (≥ 640C) seems not suitable. 630C was chosen as initial Ta because at this temperature, the result showed the brightest band (Figure 2A) and the lowest Ct value (26.48) (Figure 2B).
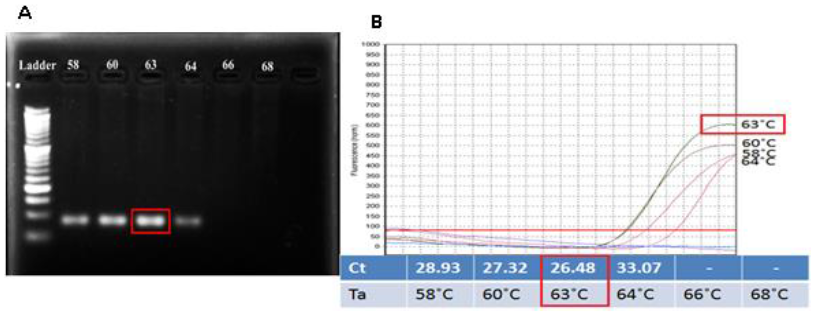
Fig. 2. Checking the suitable Ta for amplifying the target amplicon by the designed primers. Pictures (A) showed gel analysis result and (B) showed result in form of amplification curves and Ct values for each temperature. Both pictures indicated similar result: 630C is the optimal annealing temperature.
The best concentration of MgCl2, DNA, and primers:
Primer concentration: The concentration range of primer was from 0.1μM to 0.4μM. All concentrations gave out the clear bands and no presence of extra bands on gel. The more amount of primer concentration was added, the brighter the band on gel gave out (Figure 3). Though the primer at 0.1μM also signified the band on gel, it had the highest Ct value (28.97) (Figure 3B), lowest plateau height. Therefore, it may decrease the accuracy during the detection genotypes In addition, the amplification curves representing the amount of PCR product of primers at 0.2μM to 0.4μM had no significant difference in the Ct values and their plateau heights were relatively similar. As a result, the concentration of primer should be chosen at 0.2μM to minimize the reagent.
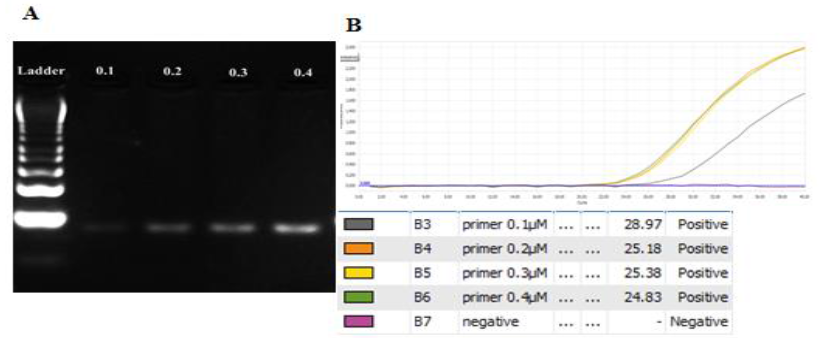
Fig. 3. Optimizing the primer concentration for amplifying the target amplicon with the gradient from 0.1μM to 0.4μM. A. gel analysis result. B. Amplification curves and Ct values for each concentration. 0.2μM was the chosen primer concentration.
DNA concentration: From 20ng to 50ng the PCR product showed clearly on gel while in higher concentration of DNA (60ng/reaction) gave out not good result (Figure 4). Using 60ng/reaction was really high DNA concentration that gave out not good result and inhibited the amplification process (Figure 4A). The difference in Ct values between DNA concentrations (20ng – 50ng) is not very significantly different (Figure 4B). Thus, DNA around 20ng/reaction was chosen to carrying out in this assay and to save the genetic material.
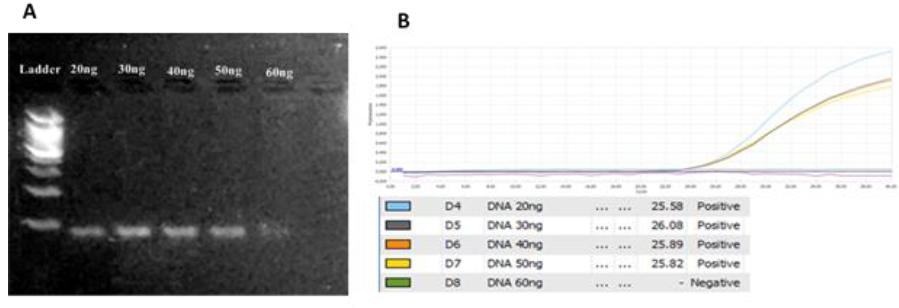
Fig. 4.The optimization of DNA concentration from 20ng/reaction to 60ng/reaction. A. gel analysis.B. Amplification curves and Ct values for each concentration. 20ng/reaction was selected DNA concentration.
MgCl2 concentration: A range of MgCl2 concentration from 1.5mM to 3.5mM has been examined to find out which concentration of MgCl2 would show the best amplification. The result of MgCl2 optimization revealed that at concentration from 2.5mM to 3.5mM, the bands were clear and no occurrence minor bands while at low concentration of MgCl2, there was no band or no PCR product (Figure 5A). Analyzing the result based on real time PCR curve, the Ct values of condition with 3 and 3.5mM seem bester than 2.5mM (Figure 5B). However, the concentration at 3.5mM showed the highest plateau height. Combining to analysis, the 3.5mM MgCl2/reaction was selected for further study.
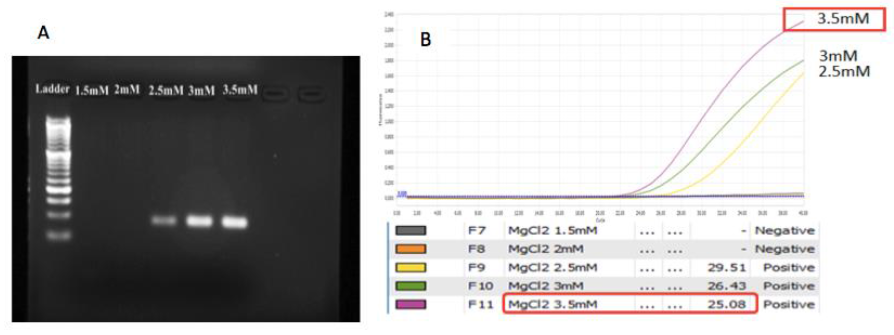
Fig. 5. The impact of MgCl2 concentration on amplification. A. gel analysis. B. The curves and the Ct values for each concentration in PCR analysis. 3.5mM is the chosen MgCl2 concentration.
Identifying control samples by sequencing: To increase the reliability of HRM method, 3 positive control samples should be identified and included in each assay performance. For that reason, using initial optimal HRM conditions, screening 6 random samples was to observe the different patterns of melt curves (Figure 6). Three samples which represented for each melting curve patterns group were chosen to undergo sequencing analysis to confirm their genotypes.
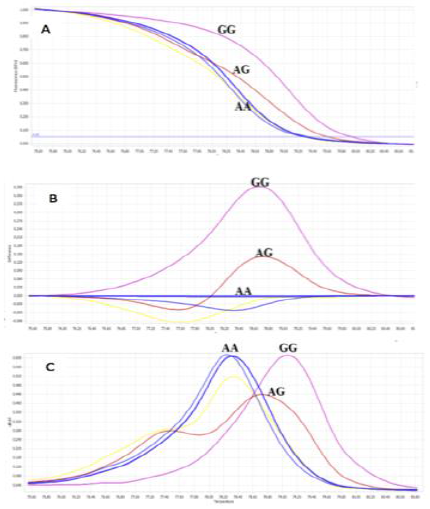
Fig. 6.The initial screening of 6 samples was identified the group of genotypes (homozygous wild-type (AA), homozygous mutant (GG), and heterozygous (AG)) using initial optimum conditions by the Normalized melting curves (A), Difference Plot (B), and Normalized melting peak (C).
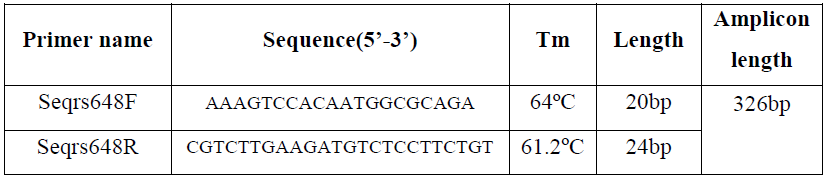
The primers for sequencing were designed using Primer3Plus with amplicon 326bp in length. The Tm of forward primer was 64˚Cand reward primer was 61.2˚C as can see in Table 4:
Table 4.Detail characterizes of sequencing primers:
One sample for each group was selected for sequencing to confirm the genotypes by using Sequencing Analysis 5.3 software. Luckily, the result showed exactly three control samples with three different genotypes. Two homozygous samples, homozygous mutant and homozygous wild-type were indicated by the performance mutant position by the G and A alleles respectively. However, in the sequence of heterozygous control sample, we could observe two overlapping peaks of fluorescent, representing both the allele A and allele G (Figure 7C).
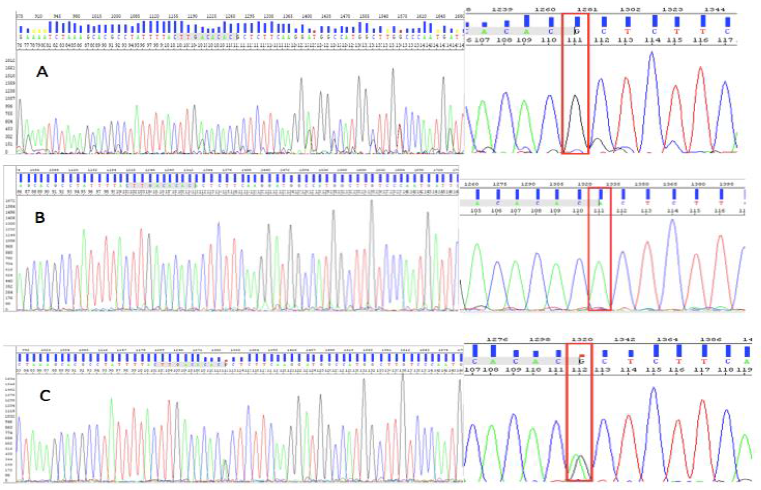
Fig. 7. Three control samples were identified by sequencing homozygous genotype (GG) (A), wild-type genotype (AA) (B), and heterozygous genotype (AG) (C).
The optimum MgCl2 concentration for HRM analysis: With the initially optimum condition, the genotyping results revealed that the clusters of different genotypes were still unclear to identify (Figure 6). That means the initial condition may be not really ideal for HRM analysis. According to Umelt prediction software, MgCl2 concentration has notable effects on HRM melting curve discrimination. Thus the concentration of MgCl2 (2mM – 3.5mM) was chosen for optimizing again on three control samples. At 2mM MgCl2, three control samplesshowed the negative at this concentration (Figure 8A). The concentration of MgCl2 at 2.5mM can make two homozygous genotypes cluster (Figure 8B). This may lead to missed calling 2 genotypes when analyzing many samples. The analyzed results of MgCl2 at 3mM and 3.5mM based on the melting peak have similar, clear, and correct shapes. The higher MgCl2 concentration may generate undesired PCR product then yield unclear result 10 like previous HRM analysis for screening the controls. Moreover, ought to the easier and faster analysis, the lower Tm was chosen. Hence, 3mM MgCl2 was applied for further HRM analysis.
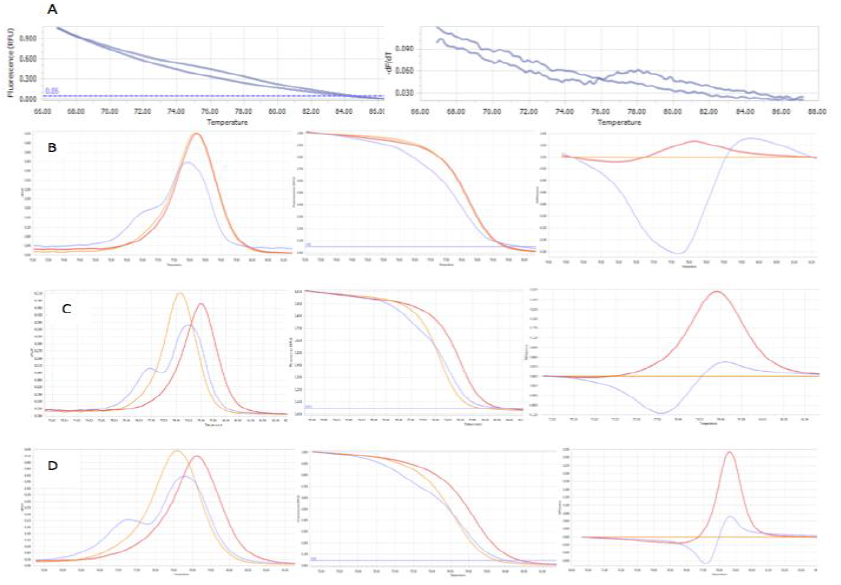
Fig. 8.The three genotypes at different concentration of MgCl2: at 2mM (A), at 2.5mM (B), at 3mM (C), at 3.5mM (D). The concentration of MgCl2 at 3mM finally was chosen for further assay.
In summary, the optimum PCR – HRM analysis conditions for further study were identified with 3mM MgCl2, Ta 63ºC, 0.2 μM primer, and 20ng DNA/reaction.
The result of genotyping:
Applying the HRM optimized conditions: 3mM MgCl2, Ta 63ºC, and 0.2μM primer, the 109 DNA samples were identified genotypes. The genotypes were clustered into three groups and were so clear and easy to observe (Figure 9). However, in some cases, the curves were not clearly clustered into three genotypes. These samples were excluded from the data for better analysis.
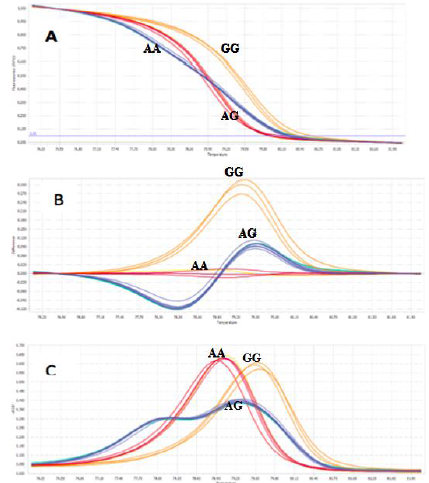
Fig. 9. Three genotypes (AA, AG, and GG) of SNP rs1219648 were clearly distinguished in analysis by the normalized melting curves (A), the difference plot results of detection genotypes (B), and the Normalized melting peaks (C).
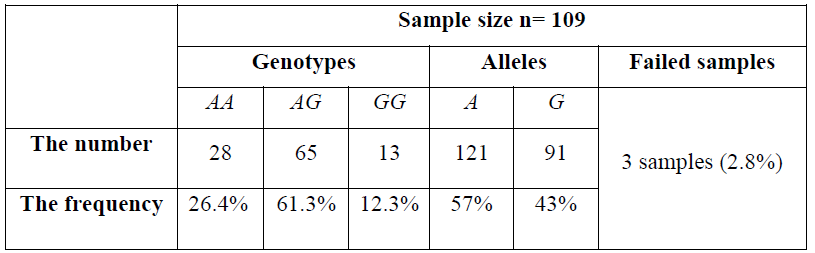
Screening 109 DNA samples by HRM analysis, the results were summarized by the following Table 6. Three samples were not identified and indicated as failed samples making up 2.8% in the group of 109 breast cancer cases.
Table 6. The frequencies of three genotypes and the A and G alleles:
Discussions
The objective of this project is to study the development High Resolution Melting method for genotyping the SNP rs1219648 in Vietnamese breast cancer patients. The results of this study not only broaden the research and development of diagnostic methods and early diagnosis of breast cancer risk in Vietnamese but also provide the information for the field of cancer research all over the world. The advantages of HRM analysis are its feasibility and high-accuracy method in screening SNP rs1219648 according to the melting curve. In comparison with ARMS PCR, HRM method has many advantages that overweight the ARMS PCR method. A predominant and important point is primers of HRM are more reliable than primers of ARMS PCR. The nonspecific case does not happen as much as ARMS-PCR. Moreover, this method does not use toxic chemical like which is very dangerous for user. Furthermore, it is less expensive, fast and more efficient. Therefore, these features support the high value of this technique for reliable genotyping, simple and fast in routine diagnostic setting.
The greatest effect was observed with Mg2+. The HRM Master Mix contains too small amount of Mg2+ and it is recommended that the adjustment of Mg2+ optimized for new assay prior to large scale analysis. This will result in reduced nonspecific amplification, allowing clearer distinction of sequence variations. If Mg2+ concentration is too low, no PCR product will be seen. Nevertheless, using high concentrations of Mg2+increases the likelihood of nonspecific primer binding and unwanted product formation.
After optimization, the optimum PCR conditions were applied to detect the genotypes. When checking the results, some samples had deviatory curves. It may be caused by the unequal quality of DNA which may affect the genotype curve. Moreover, the unclear genotype may be affected by the presence of another SNP in the same amplicon. Three samples with strange melting curve may contain a mutation allele instead of wild type allele as we used for designing and optimizing the HRM condition. Try to predict the melting curve for these samples by UMelt, the results revealed that they were really different (data not shown). Thus, the excluding three strange melt curve samples would make the data for genotype frequency analysis becomes better.
Association study between this SNP and breast cancer risk has been performed in several population, which includes: Japanese, German, Chinese, American, Indian, etc. Among these, research on Chinese population revealed that mutation allele G had correlation to higher breast cancer risk. The homozygous mutation genotype (GG) also showed significant association with breast cancer (p=0.016) while heterozygous genotype (AG) showed the p> 0.05. That means risk allele may be G allele and homozygous mutant genotype (GG) can increase the breast cancer risk. Besides, Chinese population is believed to have close genetic relationship with Vietnamese. Therefore, in Viet Nam population, allele G may be also be the risk allele and the genotype increasing breast cancer may be homozygous mutant (GG). In this study, the G allele frequency was found to be 43% which is considered relatively high. According to the previous papers, in China, the frequency of G allele in the breast cancer case was 43% (8) , in Japan, the G allele frequency was 38.05% (9), and in North India, this frequency was 44,02% (10). In comparison, the G allele frequency in Vietnamese patients were roughly similar the frequency of G allele in the Chinese, Japanese, and Indian patients. To confirm risk allele as well as risk genotype in Vietnamese, the association study must be conducted to analyze the correlation between the SNP rs1219648 and the breast cancer risk.
In conclusion, we have successfully performed High Resolution Melting for the genotyping of SNP rs1219648. 105 breast cancer samples were screened successfully with the AA, GG, and AG genotypes frequencies (26.4%, 12.3%, and 61.3%, respectively) and identified 2.8% genotyping error eliminates. In the future, we will develop HRM method for detection SNP rs1219648 on the large number of samples and other point mutations. The SNP rs1219648 will be continued to research more about the association with the breast cancer in Vietnamese patients.
Acknowledgement
This research is funded by Vietnam National Foundation for Science and Technology Development (NAFOSTED) under grant number 106-YS.01-2013.09.


Add new comment