Duc-Hau Le
Abstract
One of the challenging issues in biomedicine is to identify candidate genes likely to be associated with specific diseases. To tackle this issue, many computational methods have been developed for ranking disease candidate genes according to their relevance to a disease of interest. This relevance has been defined as functional similarity or relatedness between candidate genes and known disease-associated genes. In addition, it is widely accepted that most functions of cell are controlled by biological networks constituted by interactions between genes, proteins, metabolites and other molecules. Defects by mutations on genes/proteins may cause a disease occurred in a person. Also, these mutations may affect other genes/proteins through structures of the biological networks. In this study, we propose a novel method, namely BoolDGP, to assess the relevance of candidate genes to a disease of interest by measuring the degree of mutational effect from known disease-associated genes to candidate genes. Particularly, we mutate known disease-associated genes and measure the effect of this mutation on candidate genes based on Boolean dynamics of biological networks. Based on this value, candidate genes can be prioritized and finally top-ranked candidate genes can be selected as novel promising disease genes. Simulation results on a set of diseases showed that the proposed method is superior to a state-of-the-art one, which is based on a random walk with restart algorithm. Using the proposed method, we identified 27 genes associated with breast cancer with evidences from literature.
Introduction
Disease gene prioritization, the task of predicting the most plausible candidate disease genes, is an important issue in biomedical research, and a variety of approaches have been proposed (1, 2). Identification of disease-associated genes also leads to more effectively researches about therapies for genetic diseases (e.g., hypertension, breast cancer, etc…) and gradually approaches a future of personalized medicine. In past decades, linkage analysis was usually used to identify novel disease genes, in which susceptible loci including hundreds of genes are investigated, and thus it is much costly for doing many experiments in wet lab. Therefore, ranking/prioritization methods for such candidate genes are introduced (genes are ordered by their relevance to a disease of interest). Highly ranked genes are further investigated to find out associated biomedical evidences. Therefore, the goal of gene ranking/prioritization is to identify novel disease-associated genes.
The candidate gene prioritization methods have been proposed by three main directions: i) Functional annotation-based; ii) Network-based; and iii) Machine learning-based. In which, functional annotation-based methods have prioritized candidate genes by measuring the degree of similarity of each candidate genes to a set of known disease genes based on profiles which were built from many functional annotation data sources (3, 4, 5). Therefore, those methods mostly focused on the integration of various biological datasets in order to obtain more accurate similarity. However, those approaches are limited in that functional annotation data sources have not covered whole human genome yet. Beside the functional annotation-based methods, machine learning-based techniques based on binary classifiers for identification of disease-associated genes have been also studied. At the early, machine learning-based studies usually approached disease gene prediction as a binary classification problem. Indeed, a number of binary classification techniques have been proposed to the problem such as decision tree (6, 7) k-nearest neighbors (8), Naïve Baysian classifier (9, 10), artificial neural network (11, 12) and support vector machine (13, 14, 15). In these studies, the learning samples are comprised of positive training samples and negative training samples. In which, positive training samples are constructed from known disease genes, whereas negative training samples are the remaining which are not known to be associated with diseases. This is the limitation of binary classifier-based solutions for disease gene prediction problem, since the negative training set should be actual non-disease genes. However, construction of this set is nearly impossible in biomedical researches because it is often the case in biomedicine that not observing an association does not imply the association does not exist (there are no proven negatives). In fact, the unknown set may contain unknown disease genes; therefore, to reduce this uncertainty of the earlier methods, semi-supervised methods have been proposed to the problem (16, 17, 18), where the classifier is learned from both labeled (i.e., known disease genes) and unlabeled (i.e., the unknown genes) set. However, negative samples must be still defined in those studies. To overcome limitations of these two main approaches, network-based methods for identification of disease-associated genes have been proposed (19, 20). These network-based methods mainly based on biological networks and therefore they are not limited by the coverage of functional annotation data sources. In addition, they dominate the other two main approaches is because they are based on a principle of “disease module” (e.g., genes/proteins associated with the same or similar diseases usually form functional/physical modules on gene/protein interaction networks (21, 22, 23)). Furthermore, network-based methods target to the essence of disease gene prediction problem, which is ranking/prioritization, instead of classification of candidate genes (i.e., assign a candidate gene to either disease genes or non-disease gene class) as machine learning-based methods do.
It is widely accepted that defects by mutations on genes/proteins may cause a disease occurred in a person. Also, these mutations may affect other genes/proteins through structures of the biological networks. This phenomenon has an underlying reason that mutations on genes/proteins affect the robustness of biological networks and propagation of the effect is controlled by structural properties of biological networks. In this study, we propose a new method, namely BoolDGP, based on Boolean dynamics of biological network to measure the effects from known disease genes to candidate genes. Based on this value, candidate genes can be prioritized and finally top-ranked candidate genes can be selected as novel promising disease genes for further experimental studies. Comparing performance of the proposed method on a set of 25 disease phenotypes with that of a state-of-the-art network-based method, Random Walk with Restart (RWR) algorithm (24), we found that our method outperforms the RWR-based one. In addition, we used the proposed method to identify novel breast cancer-associated genes. Interestingly, 27 out of 50 highly ranked candidate genes are evidenced to be associated with breast cancer.
Materials and Methods
Biological networks and known disease gene associations datasets
To assess mutational effects of known disease-associated genes to candidate genes, we used a large-scale human signaling network collected from a published study (25). This network consists of 1,539 nodes and 4,754 interactions and is the largest one available on literature. In addition, a set of diseases and their known associated genes were collected from OMIM (26). Because only small set of genes are available on the current human signaling network and only diseases with at least two known associated genes are suitable for leave-one-out cross validation analysis; therefore, a set of 25 disease phenotypes was finally selected.
Boolean dynamics-based measure for prioritizing candidate genes
To define a measure assessing the mutational effects of known disease-associated genes on candidate genes, we employed a Boolean network model, which has been widely used to represent biological networks and successfully captured some biological characteristics (27, 28, 29, 30, 31, 32, 33). In particular, it has been also frequently used in simulating the dynamics of various signaling networks (34, 35, 36, 37, 38, 39, 40, 41, 42).
A random Boolean network
When a Boolean network is represented by a directed graph G (V, E), each vi∈V has a value of 1 ("on") or 0 ("off"), which represents the possible states of the corresponding elements. The value of each variable vi at time t+1 is determined by the values of ki other variables  with a link to vi at time t by the Boolean function
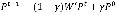
 . Hence, we can write the update rule as
 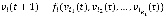 where we randomly select either a logical conjunction or disjunction for all signed relationships in fi with a uniform probability distribution. For example, if a Boolean variable v has a positive relationship from v1, a negative relationship from v2, and a positive relationship from v3, then the conjunction and disjunction update rules are
 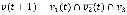 (t) and
  (t), respectively. In the case of a conjunction, the value of v at time t + 1 is 1 only if the values of v1, v2, and v3 at time t are 1, 0, and 1, respectively whereas, in the case of a disjunction, the value of v at time t + 1 is 1 if at least one of the states of the clauses, v1(t),
  , and v3(t) is 1. Although there can be many other logical functions in addition to conjunction and disjunction functions, biological networks were successfully described by Boolean models using only those two functions in many previous studies (31, 32, 33, 43, 44, 45, 46). In addition, the sign of each link is determined between positive and negative ones uniformly at random.
Given a Boolean network with N Boolean variables, v1, v2, …, vN, we define a network state as a vector consisting of values of the Boolean variables: there are 2N states in total. Each state transits to another state through a set of N Boolean update functions, f1, f2, …, fN. We can construct a state transition diagram that represents the transition of each state. A state trajectory starts from an initial state and eventually converges to either a fixed-point or a limit-cycle attractor. Attractors can represent diverse behaviors of biological networks, such as multi-stability, homeostasis, and oscillation (47, 48, 49). In addition, we define a transient sequence of values of a node v as follows: When a Boolean network G(V, A) was initialized with v1(0), v2(0), …, and vN(0) at the starting time 0, vi(t0,t1) represents a sequence of the transient values of a node vi during the time interval from t0 to t1.
Effectiveness from a node to another node in arandom Boolean network
In Boolean networks, we propose a novel measure, effectiveness, to quantify the influence from a node to anothernode in terms of the network dynamics. To define it, we first introduce two types of perturbations, an initial-state perturbation and an updating-rule perturbation. Given a Boolean network initialized with v1(0), v2(0), …, and vN(0), the initial-state perturbation at a node viÎV means flipping vi(0) to  . On the other hand, the updating-rule perturbation at a node viÎV means switching the updating-rule at vi from a conjunction function to a disjunction function or vice versa, depending on the current function type. Assuming a perturbation at vi, we define the effectiveness from vi to another node vj, e(vi, vj), as follows:
- Let τi, the valid convergent time of vi, defined as τi = max{Ti, T’i} where Ti or T’i represent the time steps for the network to converge to an attractor when vi was subject to the perturbation or not, respectively.
- We obtain two different transient sequences of vj, vj(0,τi) and v’j(0,τi), when vi was subject to the perturbation or not, respectively.
- Then, we compute e(vi, vj)=d(vj(0,τi), v’j(0,τi)) / τi where d(∙) means the Hamming distance (i.e., the number of bits having different values) between two sequences. Thus, e(vi, vj) represents how largely the trajectory with respect to vj was affected by the perturbation at vi. This also measures the mutational effect of vi to vj.
Fig. 1. An illustrative example of calculating effectiveness in a Boolean network. A Boolean network with 8 nodes and 14 links where arrows and bar-headed lines represent positive and negative interactions, respectively. ‘AND’ and ‘OR’ denote conjunction and disjunction update functions, respectively. Trajectories starting from an initial state (11010010) and another state (11011010) where v4 is subject to an initial-state perturbation. States of the network (i.e., eight-bit strings in rectangles) represent values of v0 through v7 in sequence and grayed rectangles with dashed lines mean attractors. These states and trajectories are calculated from the network. Then, effectiveness from v4 to v7 with respect to the trajectories was computed
Therefore, effectiveness is a measure about how largely each node is affected by perturbation at the other node in terms of dynamics. In a Boolean network, a node is called a functional important node if a perturbation at the node makes the network converge to another attractor, which is different from the original attractor to which the network converged when the node was not subject to the perturbation. In this regard, disease genes can be considered as important nodes in signaling networks and the effectiveness in Boolean networks can be used to represent the effectiveness on candidate genes when known disease-associated genes are mutated in signaling networks. Figure 1 shows an example of the calculation of effectiveness of v4 to v7. To compute e(v4, v7), we get two transient sequences of v7, v7(0,τ4) and v7’(0,τ4), when v4 was subject to a perturbation or not, respectively.
Effectiveness from a set of nodes to a node in arandom Boolean network
In a similar way, given an initial state, the effectiveness from a set of nodes S to a node can be calculated by applying perturbations on all nodes in the set simultaneously, and then the effectiveness from these nodes to a node vje(S, vj) is calculated. For a set of initial state Is, the effectiveness from a set of nodes to a node is formally defined as following:

For the identification of disease-associated genes, S is a set of known genes of a disease of interest, vi is one of candidate genes, then  measures the effectiveness from known disease genes to a candidate gene. Therefore, candidate genes can be ranked to be associated with the disease of interest by this measure.
A. Random Walk with Restart (RWR) algorithm
To show the advance of our proposed method, we selected a state-of-the-art network-based method, which is based on a random walk with restart (RWR) algorithm. RWR is a variant of the random walk (50) and it mimics a walker that moves from a current node to a randomly selected adjacent node or goes back to source nodes with a back-probability gÎ(0, 1). RWR can be formally described as follows:
where Pt is a N´1 probability vector of |V| nodes at a time step t of which the ith element represents the probability of the walker being at node vi∈V, and P0 is the N´1 initial probability vector where the value of an element corresponding to a non-source node or a source node is zero or 1/|S|, respectively. S is the set of source nodes. The matrix W’ is represented by a transition probability matrix and thus (W’)ij, the (i, j) element in W’, denotes a probability with which a walker at vi moves to vj among V\{vi}. Formally, for an unweighted network, it is defined as follows:

where (Vout)i is a set of outgoing nodes of vi.
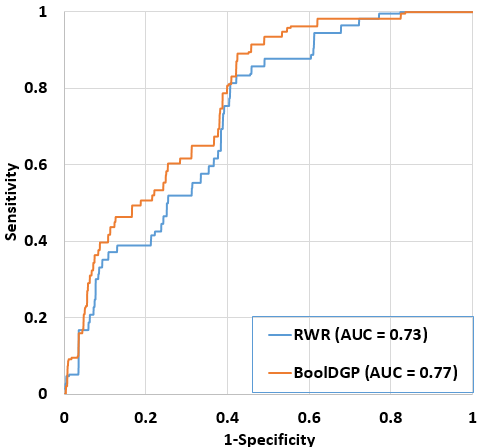
Fig. 2. Comparison of performance between BoolDGP and RWR. The performance of two methods was assessed using LOOCV method on the set of 25 disease phenotypes from OMIM. For BoolDGP, initial-state perturbation method and a set of 100 initial states were used. For RWR, the back-probability was set to 0.5.
All nodes in the network are eventually ranked according to the steady-state probability vector P¥, which is obtained by repeating the iterations until ||Pt+1-Pt||<10-6 in this study.
For the identification of disease-associated genes, S is a set of known genes of a disease of interest, an element of P¥measures how much relevant to S a gene in the network is. Therefore, it is the degree of association between a candidate gene and the disease of interest.
Performance Evaluation
Ranking performance was assessed through the leave-one-out cross-validation (Shortly called LOOCV) process. For each disease phenotype (d), in each round of LOOCV, we held out one known d-associated gene. The rest of known d-associated genes are specified to a set of source nodes (i.e., S). The held-out gene and remaining genes in the human signaling network, which were not known to be associated with d, were ranked by the two ranking methods. Then, we plotted the receiver operating characteristic (ROC) curve and calculated the area under the curve (AUC) to compare the performance of these two methods. This curve represents the relationship between sensitivity and (1-specificity), where sensitivity refers to the percentage of known disease-associated genes that were ranked above a particular threshold and specificity refers to the percentage of genes which were not known to be associated with a disease ranked below this threshold.
Results
Performance Evaluation
To assess performance of BoolDGP in ranking disease candidate genes, we randomly selected Is = 100 initial states and used LOOCV to draw the ROC curve and calculate AUC value for the set of 25 disease phenotypes collected from OMIM (See Materials and Methods section). To compare the performance of our method with that of RWR-based method, we follow the same procedure as did for BoolDGP, and set the back-probability to 0.5 since the performance of the RWR-based method is stable with the changing of the back-probability parameter (24). Figure 2 shows the performance of the two methods, it is clear that BoolDGP (AUC = 0.77) outperformed the RWR-based method (AUC = 0.73). This result implied that the disease gene prioritization problem can be approached effectively with the hypothesis that the mutation on known disease genes of a disease of interest affect other genes and this effectiveness can be used as the degree of association between candidate genes and the disease of interest.
Case study: Breast cancer
In this section, we show the ability in predicting novel genes associated with specific disease. In particular, we test our method with breast cancer (OMIM ID: 114480), this is a complex disease with 22 known associated genes. However, only ten of them are available on the human signaling network. Using these known genes as source nodes and considering other genes in the network as candidates, we calculated the effectiveness from these known genes to all the candidate genes. Candidate genes then are ranked based on the effectiveness. We selected 50 highly ranked candidates to find evidences of their association with breast cancer from literature. Interestingly, a total of 27 among them have at least one evidence to be associated with breast cancer (Table I). For example, a study showed that genomic rearrangements of the CHK1 gene is associated with breast cancer (51). Also, polymorphisms/haplotypes in GADD45A contribute to breast cancer risk, at least to sporadic breast cancer (52). In addition, high expression of HBEGF is related to the biological aggressiveness of breast cancer (53). mTOR is a critical target for survival signals generated by phospholipase D in breast cancer cells (54). Other candidate genes in the top 50 can be promising ones for future studies.
Table 1: A total of 27 among top 50 ranked candidate genes are evidenced to be associated with breast cancer from literature
|
Entrez Gene ID
|
Gene Symbol
|
PubMed ID
|
|
1111
|
CHEK1
|
20567916, 21401699, 21752283, 23844225
|
|
1647
|
GADD45A
|
15735726, 18350249, 19728081, 23158659, 23706118
|
|
1649
|
DDIT3
|
21741997, 23065795, 24625971
|
|
1839
|
HBEGF
|
17962208, 24013225
|
|
1843
|
DUSP1
|
15448190, 15590693, 19724859, 25377473
|
|
2150
|
F2RL1
|
16650817, 16925462, 19074826, 19543320, 19795460, 24177339, 24568471
|
|
2475
|
MTOR
|
12813467, 15580312, 17631500, 17911267, 18612547, 18652687, 18787170, 18831768, 20030877, 20459645, 20479250, 21046231, 21963359, 22349822, 23991038, 24323026, 24630930, 24637915, 25659153
|
|
2908
|
NR3C1
|
15590693, 17512111, 18668364, 19875955, 21868756
|
|
3339
|
HSPG2
|
23436656
|
|
375
|
ARF1
|
18990689, 21478909, 24407288
|
|
4846
|
NOS3
|
15492785, 16807677, 16821086, 17259657, 17262178, 17592771, 17726138, 19671875, 20204503, 20428939, 20720556, 21409393, 21671140, 21872972, 24265520
|
|
51085
|
MLXIPL
|
19252981
|
|
5111
|
PCNA
|
12088102, 22238610, 22622474, 23542172
|
|
51341
|
ZBTB7A
|
20394500, 21392388
|
|
5294
|
PIK3CG
|
17515959, 18625725, 18652687, 18725974, 19269083, 19471547, 20030877, 20226014, 20458733, 23500535
|
|
5313
|
PKLR
|
19655166
|
|
5333
|
PLCD1
|
11960991, 20657189
|
|
5524
|
PPP2R4
|
19890961, 24958351
|
|
5581
|
PRKCE
|
18317451, 20198332, 23562764, 24825907
|
|
6097
|
RORC
|
22404826, 24911119
|
|
6647
|
SOD1
|
16423367
|
|
7015
|
TERT
|
11788906, 11916966, 11936586, 14612409, 15202008, 15545228, 16179497, 16525654, 18413362, 18586674, 19380022, 19501078, 19596972, 19787269, 20056641, 20225759, 21411498, 21526393, 21627565, 21911295, 21949822, 22037553, 22134622, 23065203, 23158658, 23629941, 23677713, 23741361, 24216762
|
|
7161
|
TP73
|
15450420, 15849742, 16814250, 17446929, 21127199, 21933556, 22535334, 23443851
|
|
79444
|
BIRC7
|
16026775, 17035597, 23524337
|
|
8915
|
BCL10
|
16280327
|
|
8976
|
WASL
|
17985201, 20880986, 22559840
|
|
9181
|
ARHGEF2
|
22002306
|
Conclusions
In this study, we proposed a novel network-based method for identification of disease-associated genes. This is based on Boolean dynamics of biological networks under a hypothesis that mutation on known disease genes of a disease of interest affect other genes through the network and this effectiveness can be used as the degree of association between candidate genes and the disease of interest. Simulation results showed that our method is superior to a state-of-the-art network-based method. Using the proposed method, we also predicted 27 novel breast cancer-associated genes with evidences from literature. In future study, besides the Boolean dynamics, we are going to integrate structural properties of biological networks to a measure of association between candidate genes and diseases of interest since some studies have shown special structural properties of disease genes in the biological networks.
Acknowledgement
This work was supported by Vietnam Institute of Advanced Study of Mathematic (VIASM), Ministry of Education and Training under contract number 76NC/2014/VNCCCT.


Add new comment